Click here to start
Table of contents
2001 CENSUS INTERACTION DATA: RETROSPECT AND PROSPECT
Presentation
Introduction: 2001 Census interaction data
Introduction: Developments from 1991 interaction data
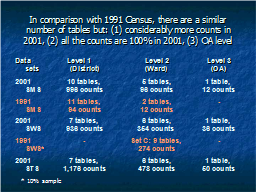
In comparison with 1991 Census, there are a similar number of tables but: (1) considerably more counts in 2001, (2) all the counts are 100% in 2001, (3) OA level
e.g. Tables and counts from 2001 SMS Level 1 and 1991 SMS Set 2 (Districts)
Slide 7
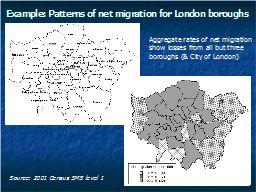
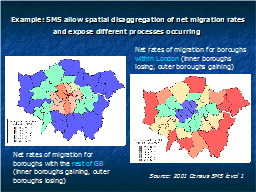
Example: SMS allow spatial disaggregation of net migration rates and expose different processes occurring
Slide 9
Slide 10
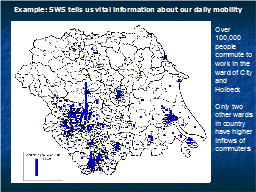
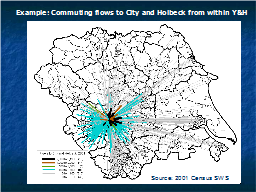
Example: Commuting flows to City and Holbeck from within Y&H
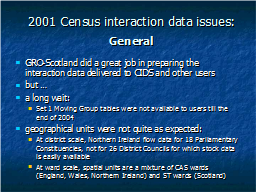
2001 Census interaction data issues: General
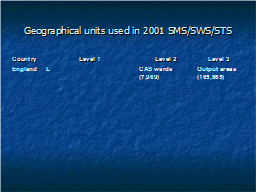
Geographical units used in 2001 SMS/SWS/STS
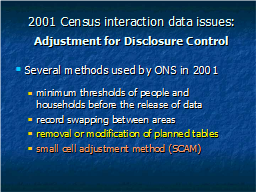
2001 Census interaction data issues: Adjustment for Disclosure Control
Removal or modification of planned tables
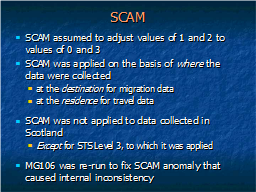
SCAM
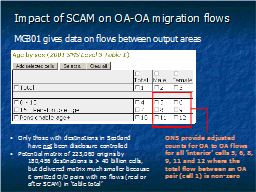
Impact of SCAM on OA-OA migration flows
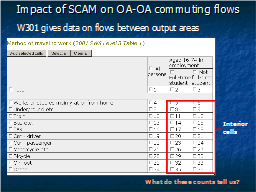
Impact of SCAM on OA-OA commuting flows
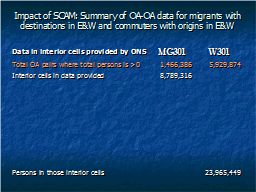
Impact of SCAM: Summary of OA-OA data for migrants with destinations in E&W and commuters with origins in E&W
Other effects of SCAM
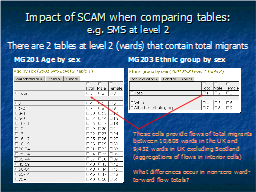
Impact of SCAM when comparing tables: e.g. SMS at level 2
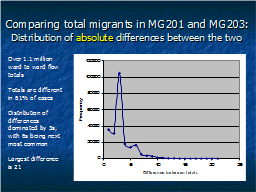
Comparing total migrants in MG201 and MG203: Distribution of absolute differences between the two
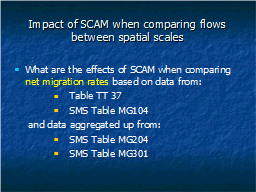
Impact of SCAM when comparing flows between spatial scales
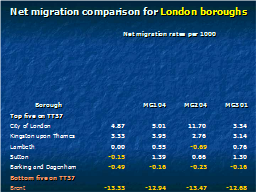
Net migration comparison for London boroughs
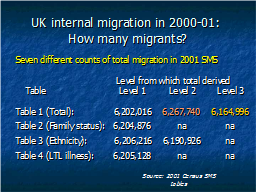
UK internal migration in 2000-01: How many migrants?
SCAM effects when making comparisons
SCAM comparisons at level 1
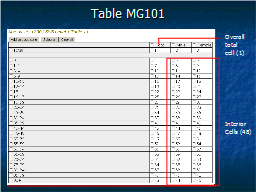
Table MG101
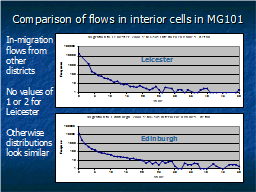
Comparison of flows in interior cells in MG101
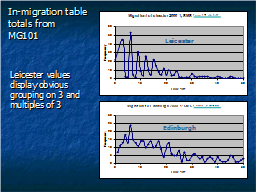
In-migration table totals from MG101
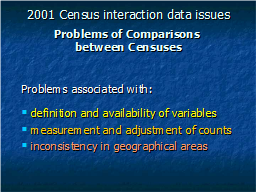
2001 Census interaction data issues Problems of Comparisons between Censuses
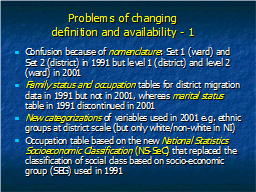
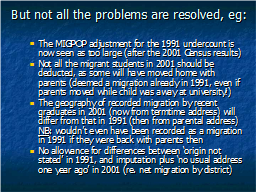
Problems of changing definition and availability - 1
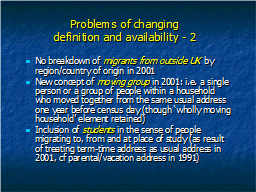
Problems of changing definition and availability - 2
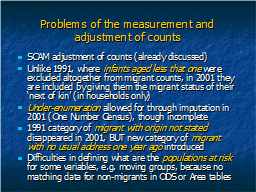
Problems of the measurement and adjustment of counts
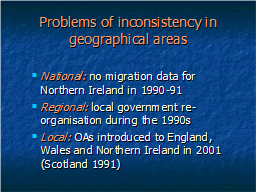
Problems of inconsistency in geographical areas
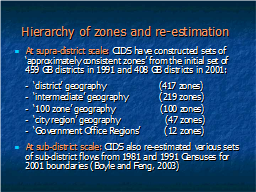
Hierarchy of zones and re-estimation
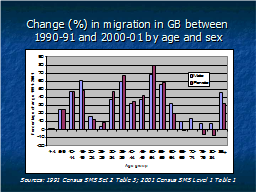
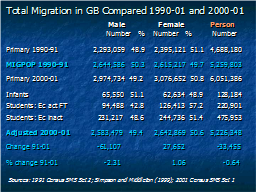
Change (%) in migration in GB between 1990-91 and 2000-01 by age and sex
Total Migration in GB Compared 1990-01 and 2000-01
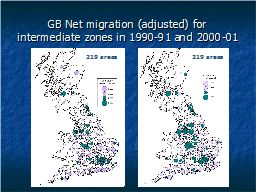
GB Net migration (adjusted) for intermediate zones in 1990-91 and 2000-01
But not all the problems are resolved, eg:
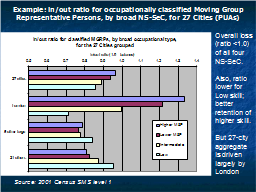
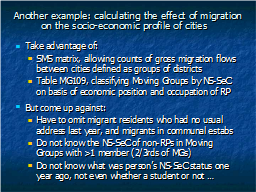
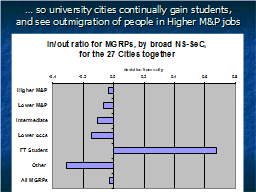
Another example: calculating the effect of migration on the socio-economic profile of cities
… so university cities continually gain students, and see outmigration of people in Higher M&P jobs
Conclusions: Looking ahead
Recommendations for 2011 outputs
Recommendations for 2011 questions
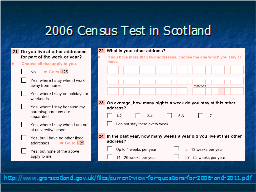
2006 Census Test in Scotland
Slide 47